Are Amazon Purchase Floors Rising for 3D Printing Product Ideas? What 90 Days Show (October 2026)
By MeshNomics Research · Published · 15 min read
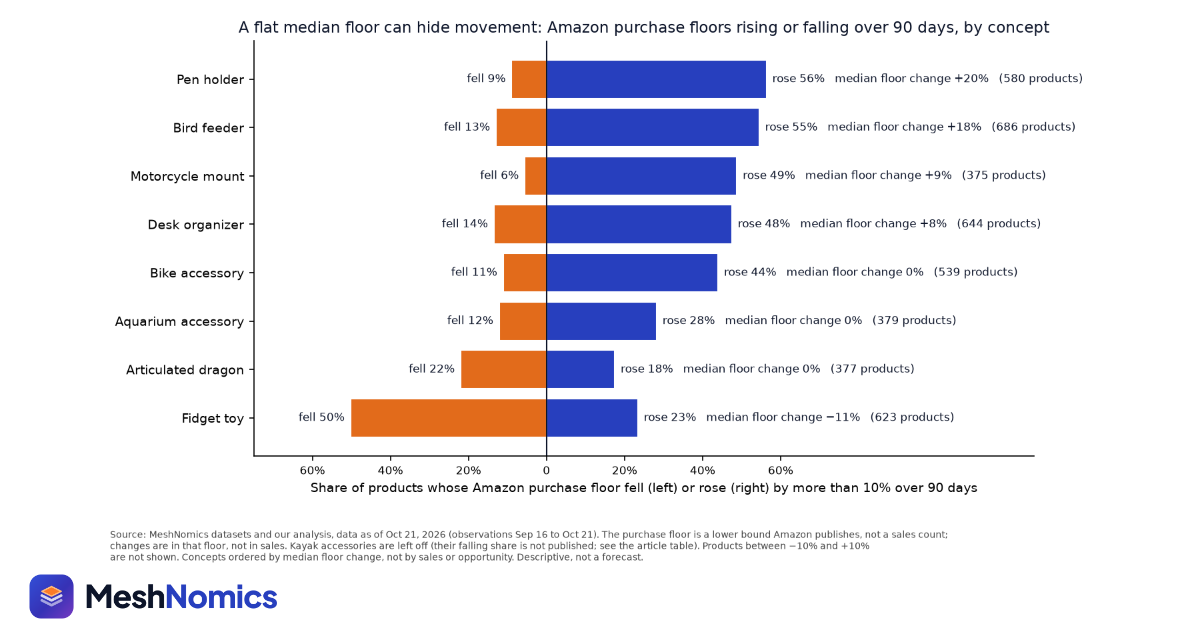
If you print for Amazon, or check Amazon before you list a product on Etsy or your own store, you have probably read a category's "trend" as one number: up, flat or down. We asked MeshNomics datasets a narrower question: over the 90 days to late October, did the purchase floor Amazon publishes rise or fall across the products in each concept relevant to 3D printing that MeshNomics tracks, and does a flat median mean nothing moved? This is a research brief, not a forecast and not advice. The purchase floor is the lower bound Amazon shows as "bought in past month", not a sales count, so every change here is a change in a published floor, not in measured sales. Data as of October 21, 2026; each figure's observation window is listed under "How we measured this".
Key findings, ranked by how much they should change your decision
- A rising median is rare. Of the 59 concepts with enough Amazon products carrying a 90-day change, only 5 show a positive median change in the purchase floor (data as of October 21, 2026). Going into the holiday season, the typical concept in this sample was not broadly warming on this measure.
- The concepts with a rising median are a mix of seasonal and everyday products. Kayak accessories show a median of +81%, pen holders +20%, bird feeders +18%, motorcycle mounts +9% and desk organizers +8%. In each where both shares are published, more products saw their floor rise by more than 10% than fall by more than 10%; for kayak accessories the falling share is not published. Seasonal timing is a hypothesis to check, not something this data shows.
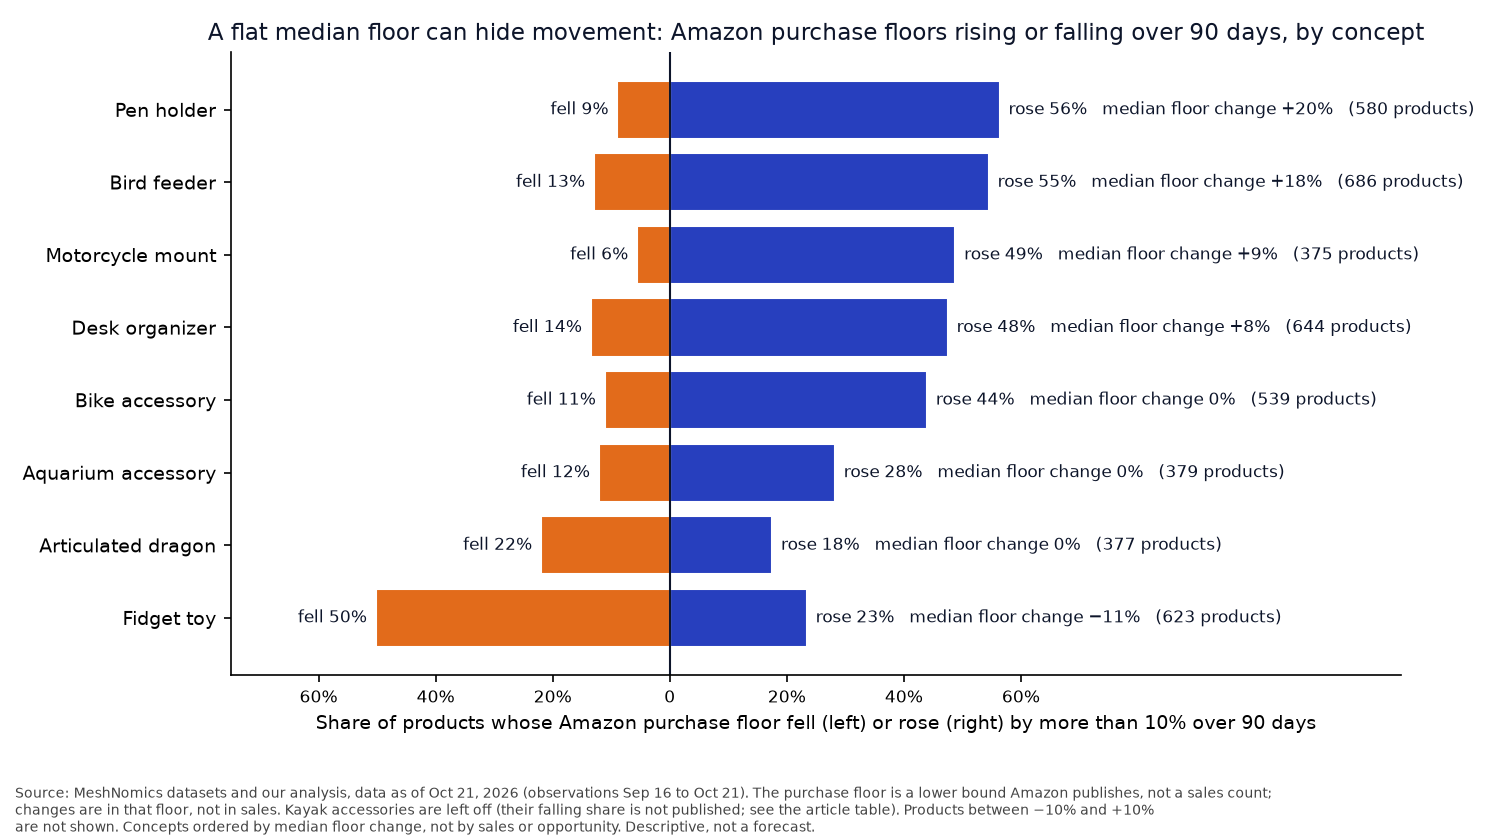
- A flat median can hide a lot of movement. Bike accessories have a median change of 0%, yet 44% of their products saw the floor rise by more than 10% and only 11% saw it fall by that much. Aquarium accessories look similar on a smaller scale. Reading the median alone would call both "flat".
- Some flat medians are two-sided. Articulated dragons also sit at a median of 0%, but 18% of products rose and 22% fell. Recorded floors rose for some sampled products and fell for others; this does not establish substitution between products or show how a new listing would do.
- Fidget toys are the clearest broad fall in this read. Their median floor change is −11%, with 50% of products down by more than 10% and 23% up. A falling floor is not proof that buyers left, but it is a reason not to treat the concept as an easy add.
Data and method, in plain words
What we read. One kind of MeshNomics dataset: Amazon products matched to the product concepts relevant to 3D printing that MeshNomics tracks, with the "bought in past month" purchase floor Amazon published for each product now and about 90 days earlier.
| Signal | What it counts | What it is not |
|---|---|---|
| Purchase floor | The lower bound Amazon publishes for how many customers bought a product in the past month | Not a sales count, not units, and not revenue |
| 90-day change in the floor | The change in a product's published floor against its level about 90 days earlier | Not a measured change in sales, and not a category's total size |
| Rising and falling shares | The share of a concept's products whose floor rose, or fell, by more than 10% | Not the share of buyers, and not a forecast of next month |
What we computed. This is pattern and trend analysis: statistical analysis of MeshNomics datasets as they stood in October 2026, using medians and shares. For each concept with enough products carrying a 90-day change, we took the median change and the shares of products whose floor rose or fell by more than 10%. Products that moved by 10% or less either way are in the median but in neither share. We did not fit a predictive model, and we did not rank concepts on a blend of signals.
What the sample is. Amazon products in our sample, matched to the product concepts MeshNomics tracks. It is not all of Amazon, and a concept groups products by what they are for, not how they are made, so many are not 3D printed. Concepts are shown where this read publishes their figures: the concepts with a rising median, plus four others. The rest are not named here.
Findings in detail
Rising and falling shares, concept by concept
| Concept | Products with a 90-day change | Median change in floor | Share whose floor rose more than 10% | Share whose floor fell more than 10% |
|---|---|---|---|---|
| Kayak accessory | 357 | +81% | 66% | not published for this group |
| Pen holder | 580 | +20% | 56% | 9% |
| Bird feeder | 686 | +18% | 55% | 13% |
| Motorcycle mount | 375 | +9% | 49% | 6% |
| Desk organizer | 644 | +8% | 48% | 14% |
| Bike accessory | 539 | 0% | 44% | 11% |
| Aquarium accessory | 379 | 0% | 28% | 12% |
| Articulated dragon | 377 | 0% | 18% | 22% |
| Fidget toy | 623 | −11% | 23% | 50% |
Concepts shown are those whose figures this read publishes. Ordered by median change, not by sales or opportunity. Changes are in a lower bound Amazon publishes, not in sales. Data as of October 21, 2026.
The table sorts into three shapes. Broad rise: the median is up and rising products clearly outnumber falling ones (kayak accessories, pen holders, bird feeders, motorcycle mounts, desk organizers). Lopsided but flat at the median (bike accessories, aquarium accessories): both concepts have a flat median, and rises beyond 10% outnumber falls beyond 10%; the share within ±10% differs by concept. Two-sided or falling: the rising and falling shares are of similar size (articulated dragons), or the falling share is larger (fidget toys).
Signal or artifact? Four things could make these shapes look different from reality. First, the floor moves in steps. Amazon shows "bought in past month" as a threshold label rather than an exact count, counts unique customers rather than units, and shows nothing below a minimum threshold (Amazon's answer on the seller forums). A product can sell more without crossing the next step, so many products register no change and a median of 0% is an expected result, not proof of a still market. One step up can also read as a large percentage, which may be part of why the kayak median looks so high. Second, timing: the window ends a couple of weeks after Amazon's October Prime event, which Adobe's holiday forecast describes as pulling holiday spending earlier, so a past-month floor read on October 21, 2026 may still carry some of that event. Third, the observation windows differ by concept (they are listed under "How we measured this"), and some are short. Fourth, the concept label is one we assign, so a concept can hold quite different products.
What the shapes mean for a small seller
A broad rise is the most useful shape to start from, because more of the sampled products in the concept recorded a higher floor, not just one or two. It still does not show that the concept will keep rising or tell you which product to make, and many products in these concepts are not 3D printed. A lopsided-but-flat concept, like bike accessories, is worth a closer look at which sampled products rose and what they have in common; the aggregate supports that inspection, not a conclusion that the opportunity sits in one sub-type. In a two-sided concept, like articulated dragons, recorded floors rose for some sampled products and fell for others; this does not establish substitution between products or show how a new listing would do.
Some of the rising concepts carry extra checks. Motorcycle and bike mounts hold things on a moving vehicle, so fit, materials and liability matter more than for a desk item (product safety for 3D print sellers). Bird feeders sit outdoors, so material choice and UV exposure affect whether a print lasts.
Signal or artifact? Rising floors on Amazon are not evidence that the same product will move on Etsy or your own store. A companion MeshNomics brief on estimated Etsy sales found bird feeders thin on Etsy in the same snapshot, at about 4 estimated sales a month for the 10th sampled listing. Read each channel on its own.
What the data does not show, and what to do about it
- Sales. These are changes in a published lower bound. They are not sales counts, units or revenue. If you already sell in a concept, your own order history beats any floor.
- Why a floor moved. Season, promotions, a single breakout product or a stock-out at a competitor could each move a floor, and none of them is in this read. Open the products that rose and note what they share.
- Concepts we don't name. Only concepts whose figures this read publishes appear. Absence is not proof of a falling or flat concept.
- The next few months. This is a 90-day look back, not a forecast. Holiday buying can lift or reverse a floor quickly, so re-read your concept before you commit stock.
- Like-for-like competition. A concept-level shift says nothing about the specific listings you would compete with. Find the products that match yours before you decide.
- Your costs. A rising floor says nothing about whether your unit pays. Price a unit with fees against current like-for-like comparables (fee calculator, cost calculator).
- Legal clearance. If you plan to sell prints of a design you didn't make, verify its licence on the model page first; a free download is not permission to sell (licence guides). For how MeshNomics treats each signal, see the methodology.
Decision framework: test, originate, gather evidence or skip
These rows are not advice and not a prediction of results. They are a way to decide how much evidence to gather, and how much printer time to risk, before you act on a concept's Amazon trend.
| What you see in this sample | What it suggests | Next step | Check in MeshNomics |
|---|---|---|---|
| Broad rise: median up, rising products clearly outnumber falling ones (pen holders, desk organizers in this snapshot) | Test a small run of a product you can make well | Find the current Amazon products that match your contents, size and material, price a unit with fees, set a test price and a stop rule, and judge it on your own orders | Niche pages, how to price 3D prints |
| Lopsided but flat at the median (bike accessories in this snapshot) | Gather evidence on which sampled products rose | Open the products that rose and look for a shared type, size or use; only then pick one to test | Evaluate a product idea |
| Two-sided: rises and falls of similar size (articulated dragons in this snapshot) | Originate (one option) only with a clear difference | The aggregate does not show how a new listing would do; if you have a design difference, check it against current listings and confirm the licence, then test small | Licence guides |
| Broad fall: median down, falling products outnumber rising ones (fidget toys in this snapshot) | Skip a generic version for now | Put the printer time into a concept with a broader rise, or revisit with a product difference you own | Niche pages |
| Rising floor on Amazon, thin Etsy estimates (bird feeders in this snapshot) | Test on the channel you compare first | Compare current like-for-like listings on each channel and run a small channel-specific test; one channel's floor doesn't rule the other in or out | Fee calculator |
Before you act on an Amazon trend, check:
- Whether the concept's rise is broad (many products) or concentrated (a few), not just its median
- Which current products match your contents, size and material, and whether those are the ones that rose
- Your unit cost with failed prints, packing and fees against those comparables, with a test price and stop rule written down (fee calculator)
- Safety and material needs for mounts and outdoor items
- That your design is your own, or that the licence on the model page allows selling prints
Caveats
This is a descriptive read of MeshNomics datasets in October 2026, with each figure's observation window listed below. It describes changes in a lower bound Amazon publishes, in a sample of products matched to concepts we track, not sales, not all of Amazon, and not a forecast. Re-check your own concept on the day you decide.
How we measured this
Every figure in this article comes from MeshNomics' research data. Groups of fewer than 10 are left out, and counts of 1 to 4 are not printed; a count of zero is.
Where Amazon buying is moving
- All concepts, concepts with 10+ products carrying a 90-day change: 59. Count of what we recorded, recorded 2026-09-16 to 2026-10-21.
- All concepts, concepts whose median change is positive: 5, out of 59 concepts. 90-day change in the purchase floor, recorded 2026-09-16 to 2026-10-21.
- Kayak accessory, median 90-day change in the purchase floor: +81%, out of 357 products with a 90-day change. 90-day change in the purchase floor, recorded 2026-09-26 to 2026-10-21.
- Pen holder, median 90-day change in the purchase floor: +20%, out of 580 products with a 90-day change. 90-day change in the purchase floor, recorded 2026-10-10 to 2026-10-20.
- Bird feeder, median 90-day change in the purchase floor: +18%, out of 686 products with a 90-day change. 90-day change in the purchase floor, recorded 2026-10-05 to 2026-10-21.
- Motorcycle mount, median 90-day change in the purchase floor: +9%, out of 375 products with a 90-day change. 90-day change in the purchase floor, recorded 2026-10-09 to 2026-10-21.
- Desk organizer, median 90-day change in the purchase floor: +8%, out of 644 products with a 90-day change. 90-day change in the purchase floor, recorded 2026-09-16 to 2026-10-21.
- Bike accessory, median 90-day change in the purchase floor: 0%, out of 539 products with a 90-day change. 90-day change in the purchase floor, recorded 2026-09-20 to 2026-10-21.
- Bike accessory, share whose floor rose more than 10%: 44%, out of 539 products with a 90-day change. 90-day change in the purchase floor, recorded 2026-09-20 to 2026-10-21.
- Bike accessory, share whose floor fell more than 10%: 11%, out of 539 products with a 90-day change. 90-day change in the purchase floor, recorded 2026-09-20 to 2026-10-21.
- Articulated dragon, median 90-day change in the purchase floor: 0%, out of 377 products with a 90-day change. 90-day change in the purchase floor, recorded 2026-10-02 to 2026-10-21.
- Articulated dragon, share whose floor rose more than 10%: 18%, out of 377 products with a 90-day change. 90-day change in the purchase floor, recorded 2026-10-02 to 2026-10-21.
- Articulated dragon, share whose floor fell more than 10%: 22%, out of 377 products with a 90-day change. 90-day change in the purchase floor, recorded 2026-10-02 to 2026-10-21.
- Fidget toy, median 90-day change in the purchase floor: −11%, out of 623 products with a 90-day change. 90-day change in the purchase floor, recorded 2026-09-26 to 2026-10-20.
- Fidget toy, share whose floor fell more than 10%: 50%, out of 623 products with a 90-day change. 90-day change in the purchase floor, recorded 2026-09-26 to 2026-10-20.
- Fidget toy, share whose floor rose more than 10%: 23%, out of 623 products with a 90-day change. 90-day change in the purchase floor, recorded 2026-09-26 to 2026-10-20.
- Kayak accessory, Amazon products with a 90-day change in their purchase floor: 357. Count of what we recorded, recorded 2026-09-26 to 2026-10-21.
- Kayak accessory, share whose floor rose more than 10%: 66%, out of 357 products with a 90-day change. 90-day change in the purchase floor, recorded 2026-09-26 to 2026-10-21.
- Pen holder, Amazon products with a 90-day change in their purchase floor: 580. Count of what we recorded, recorded 2026-10-10 to 2026-10-20.
- Pen holder, share whose floor rose more than 10%: 56%, out of 580 products with a 90-day change. 90-day change in the purchase floor, recorded 2026-10-10 to 2026-10-20.
- Pen holder, share whose floor fell more than 10%: 9%, out of 580 products with a 90-day change. 90-day change in the purchase floor, recorded 2026-10-10 to 2026-10-20.
- Bird feeder, Amazon products with a 90-day change in their purchase floor: 686. Count of what we recorded, recorded 2026-10-05 to 2026-10-21.
- Bird feeder, share whose floor rose more than 10%: 55%, out of 686 products with a 90-day change. 90-day change in the purchase floor, recorded 2026-10-05 to 2026-10-21.
- Bird feeder, share whose floor fell more than 10%: 13%, out of 686 products with a 90-day change. 90-day change in the purchase floor, recorded 2026-10-05 to 2026-10-21.
- Motorcycle mount, Amazon products with a 90-day change in their purchase floor: 375. Count of what we recorded, recorded 2026-10-09 to 2026-10-21.
- Motorcycle mount, share whose floor rose more than 10%: 49%, out of 375 products with a 90-day change. 90-day change in the purchase floor, recorded 2026-10-09 to 2026-10-21.
- Motorcycle mount, share whose floor fell more than 10%: 6%, out of 375 products with a 90-day change. 90-day change in the purchase floor, recorded 2026-10-09 to 2026-10-21.
- Desk organizer, Amazon products with a 90-day change in their purchase floor: 644. Count of what we recorded, recorded 2026-09-16 to 2026-10-21.
- Desk organizer, share whose floor rose more than 10%: 48%, out of 644 products with a 90-day change. 90-day change in the purchase floor, recorded 2026-09-16 to 2026-10-21.
- Desk organizer, share whose floor fell more than 10%: 14%, out of 644 products with a 90-day change. 90-day change in the purchase floor, recorded 2026-09-16 to 2026-10-21.
- Bike accessory, Amazon products with a 90-day change in their purchase floor: 539. Count of what we recorded, recorded 2026-09-20 to 2026-10-21.
- Aquarium accessory, Amazon products with a 90-day change in their purchase floor: 379. Count of what we recorded, recorded 2026-10-07 to 2026-10-21.
- Aquarium accessory, median 90-day change in the purchase floor: 0%, out of 379 products with a 90-day change. 90-day change in the purchase floor, recorded 2026-10-07 to 2026-10-21.
- Aquarium accessory, share whose floor rose more than 10%: 28%, out of 379 products with a 90-day change. 90-day change in the purchase floor, recorded 2026-10-07 to 2026-10-21.
- Aquarium accessory, share whose floor fell more than 10%: 12%, out of 379 products with a 90-day change. 90-day change in the purchase floor, recorded 2026-10-07 to 2026-10-21.
- Articulated dragon, Amazon products with a 90-day change in their purchase floor: 377. Count of what we recorded, recorded 2026-10-02 to 2026-10-21.
- Fidget toy, Amazon products with a 90-day change in their purchase floor: 623. Count of what we recorded, recorded 2026-09-26 to 2026-10-20.
How steep the top of each Etsy category is
- Bird feeder, estimated monthly sales of the 10th sampled listing: 4. Estimated monthly sales, recorded 2026-10-09 to 2026-10-21.
What these numbers are, and are not
- Count of what we recorded. Counts are of the listings, products or designs in our research sample. They describe the sample, not the whole market.
- 90-day change in the purchase floor. The 90-day change compares a product's published purchase floor with its level about 90 days earlier. It is a change in a lower bound, not a measured change in sales, and it says where buying appears to be moving, not why.
- Estimated monthly sales. Etsy does not publish sales by listing. These are estimates for a stated one-month window, not Etsy's own figures, and the listings behind them lean toward each category's best sellers. They are estimates, not receipts.
These are descriptive figures about the market as we sampled it, read on 2026-10-21 (evidence set e9c7d44847763ac7). They are not forecasts, and not advice that any product will sell. Test demand, costs and licences for your own product before you commit printer time.